

Uzbekistan’s trade relations with the United States have shown steady expansion over the past decade. In 2024, Uzbekistan exported $431 million worth of goods to the U.S. – a tenfold increase compared to 2014 ($42.4 million). The share of the U.S. in Uzbekistan’s total exports rose from 0.3% in 2014 to 1.6% in 2024, reflecting gradual diversification toward high-value markets.
Export structure
Uzbekistan’s exports to the United States remain highly concentrated in services (HS 99), which accounted for around $274 million (63.6%) of total exports in 2024. However, a noticeable shift has taken place in recent years. Exports of mineral fuels and oils (HS 27) surged from only $287 thousand in 2020 to over $117 million in 2024, elevating energy products to the second-largest export group. This trend highlights growing U.S. demand for refined energy products and by-products from Uzbekistan.
Beyond traditional sectors, several new export categories have emerged:
Aluminium and articles thereof (HS 76) rose to $11.4 million in 2024, compared to almost zero in 2020;
Aircraft and spacecraft parts (HS 88) expanded to $10.7 million;
Agricultural exports such as edible vegetables (HS 07) and coffee, tea, and spices (HS 09) jointly exceeded $3.5 million, reflecting early diversification into agro-based trade.
Overall, Uzbekistan’s exports to the United States are becoming broader in scope, gradually moving from raw materials toward industrial and agricultural goods, although the dominance of service exports persists.
| 2-digit HS Code | Product label | 2016 | 2017 | 2018 | 2019 | 2020 | 2021 | 2022 | 2023 | 2024 |
| 99 | Services | 25378 | 24144 | 31945 | 29843 | 19890 | 39774 | 108056 | 197042 | 273907 |
| 27 | Mineral fuels, mineral oils and products of their distillation; bituminous substances; mineral | 477 | 242 | 112 | 949 | 287 | 2383 | 906 | 24076 | 117281 |
| 74 | Copper and articles thereof | 0 | 8 | 0 | 0 | 0 | 0 | 0 | 22217 | 677 |
| 28 | Inorganic chemicals; organic or inorganic compounds of precious metals, of rare-earth metals | 19362 | 0 | 0 | 15 | 35 | 5 | 57 | 12 | 122 |
| 88 | Aircraft, spacecraft, and parts thereof | 9 | 1 | 1 | 219 | 0 | 4209 | 605 | 0 | 10657 |
| 84 | Nuclear reactors, boilers, machinery and mechanical appliances; parts thereof | 724 | 4313 | 910 | 811 | 367 | 1596 | 5136 | 367 | 552 |
| 07 | Edible vegetables and certain roots and tubers | 459 | 840 | 935 | 1354 | 2065 | 1970 | 2253 | 1949 | 1894 |
| 09 | Coffee, tea, maté and spices | 868 | 909 | 985 | 1419 | 2343 | 2651 | 1289 | 1176 | 1661 |
| 76 | Aluminium and articles thereof | 0 | 18 | 0 | 169 | 123 | 126 | 496 | 349 | 11444 |
| 71 | Natural or cultured pearls, precious or semi-precious stones, precious metals, metals clad | 0 | 1 | 0 | 0 | 0 | 2618 | 688 | 44 | 5726 |
| 87 | Vehicles other than railway or tramway rolling stock, and parts and accessories thereof | 4348 | 21 | 0 | 16 | 0 | 38 | 36 | 1 | 1 |
| 61 | Articles of apparel and clothing accessories, knitted or crocheted | 17 | 260 | 649 | 98 | 59 | 430 | 455 | 1122 | 886 |
| 08 | Edible fruit and nuts; peel of citrus fruit or melons | 73 | 227 | 418 | 204 | 150 | 459 | 437 | 739 | 942 |
| 85 | Electrical machinery and equipment and parts thereof; sound recorders and reproducers, television | 52 | 167 | 0 | 32 | 48 | 1065 | 128 | 815 | 425 |
| 39 | Plastics and articles thereof | 119 | 192 | 164 | 283 | 244 | 266 | 323 | 211 | 355 |
Table 1. Uzbekistan’s top 15 export products to the U.S., 2016–2024 (HS 2-digit level, thousand USD)
Source: National Statistics Committee of Uzbekistan
Import structure
In 2024, imports from the United States totaled $594 million, or 1.5% of Uzbekistan’s total imports. Although imports from the U.S. remain larger than exports, the gap is narrowing, reflecting Uzbekistan’s growing shipments of services, mineral fuels, aluminium, and aircraft components. The structure of imports reflects the technological depth of U.S. supply:
Machinery and mechanical appliances (HS 84) remain the largest category at $125 million;
Aircraft and parts (HS 88) reached $94 million;
Vehicles and transport equipment (HS 87) totaled $59 million, linked to logistics and infrastructure expansion;
Pharmaceuticals (HS 30) accounted for $20 million, maintaining steady demand;
Electrical machinery (HS 85) and precision instruments (HS 90) together exceeded $73 million, supporting modernization of industry and laboratories.
Other categories such as plastics (HS 39), rubber (HS 40), and man-made filaments (HS 54) also show steady inflows, expanding industrial linkages with U.S. suppliers.
| 2-digit HS Code | Product label | 2016 | 2017 | 2018 | 2019 | 2020 | 2021 | 2022 | 2023 | 2024 |
| 88 | Aircraft, spacecraft, and parts thereof | 216776 | 0 | 132884 | 271198 | 0 | 213 | 28 | 40429 | 93895 |
| 99 | Services | 20784 | 34161 | 63976 | 69166 | 36853 | 83086 | 95777 | 111929 | 155175 |
| 84 | Nuclear reactors, boilers, machinery and mechanical appliances; parts thereof | 81224 | 32364 | 36977 | 67603 | 67058 | 66025 | 72734 | 103972 | 124890 |
| 30 | Pharmaceutical products | 38173 | 50718 | 68693 | 68348 | 20467 | 41681 | 106845 | 11681 | 20109 |
| 87 | Vehicles other than railway or tramway rolling stock, and parts and accessories thereof | 3546 | 5207 | 6586 | 20366 | 41977 | 105946 | 33857 | 147947 | 59356 |
| 85 | Electrical machinery and equipment and parts thereof; sound recorders and reproducers, television | 15506 | 14202 | 6220 | 7915 | 6863 | 15160 | 9260 | 13088 | 45821 |
| 90 | Optical, photographic, cinematographic, measuring, checking, precision, medical or surgical | 12753 | 6727 | 4736 | 8045 | 9300 | 8805 | 10861 | 22550 | 27338 |
| 40 | Rubber and articles thereof | 2390 | 6426 | 31575 | 19816 | 2018 | 1802 | 1279 | 2668 | 3747 |
| 54 | Man-made filaments; strip and the like of man-made textile materials | 747 | 3732 | 6488 | 6365 | 4328 | 5856 | 5312 | 7153 | 6129 |
| 39 | Plastics and articles thereof | 717 | 9938 | 4401 | 2761 | 3684 | 4022 | 2879 | 5823 | 4421 |
| 38 | Miscellaneous chemical products | 1840 | 1322 | 1329 | 1031 | 20981 | 1458 | 2022 | 1810 | 4494 |
| 21 | Miscellaneous edible preparations | 407 | 376 | 397 | 532 | 2100 | 6253 | 6332 | 7206 | 6645 |
| 73 | Articles of iron or steel | 1111 | 765 | 1203 | 9107 | 3131 | 1389 | 2841 | 5142 | 5139 |
| 02 | Meat and edible meat offal | 772 | 597 | 797 | 750 | 3196 | 7421 | 5601 | 3835 | 4905 |
| 24 | Tobacco and manufactured tobacco substitutes; products, whether or not containing nicotine, | 2234 | 1466 | 1420 | 1498 | 1886 | 1615 | 1187 | 2898 | 3056 |
Table 2. Uzbekistan’s top 15 import products from the U.S., 2016–2024 (HS 2-digit level, thousand USD)
Source: National Statistics Committee of Uzbekistan
Trends and outlook
Overall bilateral trade turnover surpassed $1 billion in 2024, marking the highest level on record. Between 2021 and 2024, Uzbekistan’s exports to the U.S. grew on average by 98% per year, while imports rose by 26%, indicating an improving trade balance and a shift toward more diversified export patterns.
The United States remains a strategic trade and investment partner for Uzbekistan—providing not only high-value goods but also technological know-how and capital essential for industrial upgrading.
Future opportunities lie in expanding value-added manufacturing, digital services, and joint innovation projects, consistent with the “Uzbekistan–2030” Strategy.
In parallel with the steady growth of bilateral trade, Uzbekistan has also achieved a key institutional milestone in its integration into the global trading system. In December 2024, Uzbekistan and the United States Trade Representative (USTR) officially announced the completion of bilateral market access negotiations on goods and services within the framework of Uzbekistan’s accession to the World Trade Organization (WTO)[1].
Impact of new U.S. tariff policy
In early 2025, the United States introduced a new trade policy imposing a 10% baseline tariff on imports from all non-exempt countries, with higher rates for selected partners. For Uzbekistan, which falls under the baseline rate, the average U.S. tariff rose sharply—from 3.8% in 2024 to 18.1% in 2025. This escalation, especially in fuels and mining (29.5%) and manufacturing (14.5%), tightens market access for Uzbek exporters and could reduce competitiveness of low-margin products. Nonetheless, the tariff pattern also presents selective opportunities: moderate duties on processed foods, textiles, and industrial intermediates provide niches that could be expanded through improved certification, logistics, and trade facilitation. Regionally, Uzbekistan now occupies a middle position, facing higher tariffs than Kazakhstan but much lower than large Asian exporters like China and India, offering potential to serve as a tariff-neutral hub for re-export and light manufacturing aimed at the U.S. market. These shifts have important implications for Uzbekistan’s market positioning and sectoral competitiveness.
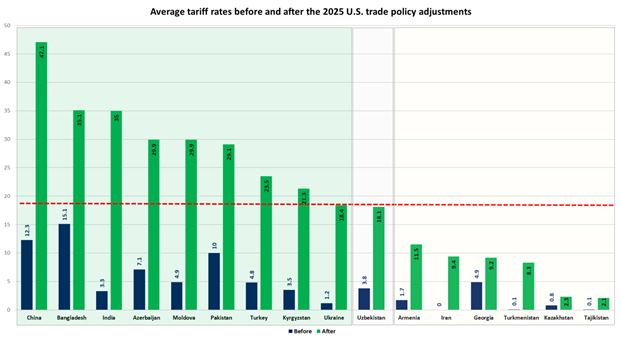
Source: UNCTAD Tariff Dashboard.
Compared with many CIS and Central Asian peers, Uzbekistan’s tariff exposure is moderate and strategically manageable.
| Sector | Pre-January 2025 tariffs | Current tariffs |
| Manufacturing | 4.5% | 14.5% |
| Agriculture | 3.0% | 13.0% |
| Fuels & mining | 5.4% | 29.5% |
Table 3: Trade-weighted average U.S. tariffs applied to imports from Uzbekistan, before and after early
2025. Source: UNCTAD Tariff Dashboard.
Although Uzbekistan’s exposure remains moderate by regional standards, sustained export growth will depend on the capacity to offset tariff-related cost pressures through productivity and quality improvements.
The new tariff regime poses both challenges and opportunities: while it may constrain low-processed exports, it incentivizes a shift toward higher-value manufacturing and agriculture. To capitalize on this asymmetry, Uzbekistan should strengthen support for sectors with moderate U.S. tariffs. With proactive trade and investment policies, Uzbekistan can turn external tariff pressures into an opportunity to diversify exports and attract export-oriented production.
Strengthening trade ties with the United States remains an important strategic goal for Uzbekistan’s long-term diversification agenda. The country’s improving export capacity, combined with its moderate exposure under the new U.S. tariff regime, provides a unique opportunity to reposition itself as a competitive, tariff-neutral hub for manufacturing and re-export within the region. Achieving this will require sustained institutional coordination, improved logistics and certification frameworks, and proactive engagement in regional and global trade partnerships.
Babadjanov Muhammad
Head of Department at Institute for Macroeconomic and Regional Studies under the Cabinet of Ministers of the Republic of Uzbekistan


